







- A +
- A
- A -
The speaker enclosure is not only the "visual highlight" of the product but also a vital component for acoustic performance. The smoothness of its curved surfaces, the precision of mounting hole positions, and the consistency of the acoustic cavity have a direct bearing on sound‑quality performance and brand image. However, speaker enclosure designs usually incorporate complex free‑form curved surfaces as well as precision functional structures, making it difficult for traditional inspection methods to comprehensively evaluate manufacturing quality. 3D scanning can fully acquire point‑cloud data for the entire curved surface, rapidly complete full‑dimension 3D inspection of the speaker enclosure, and compare results against the original CAD model to visually analyze springback, warpage and shrinkage deformation.

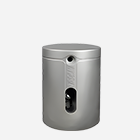
Physical picture
The speaker housing mostly features complex free‑form surfaces (such as chamfer radii and acoustic sealing grooves). Traditional measuring tools cannot accurately measure its overall profile. There are numerous densely‑arranged assembly structures including speaker mesh holes, key slots and screw posts. Minor deviations in their positional tolerances and hole diameters will directly affect the assembly yield in subsequent processes and the sealing performance of the complete unit. Traditional checking jigs can only make a qualitative “pass/fail” judgement. They are unable to provide specific deviation values and directions, which hinders precise mould modification.

On‑site scan image
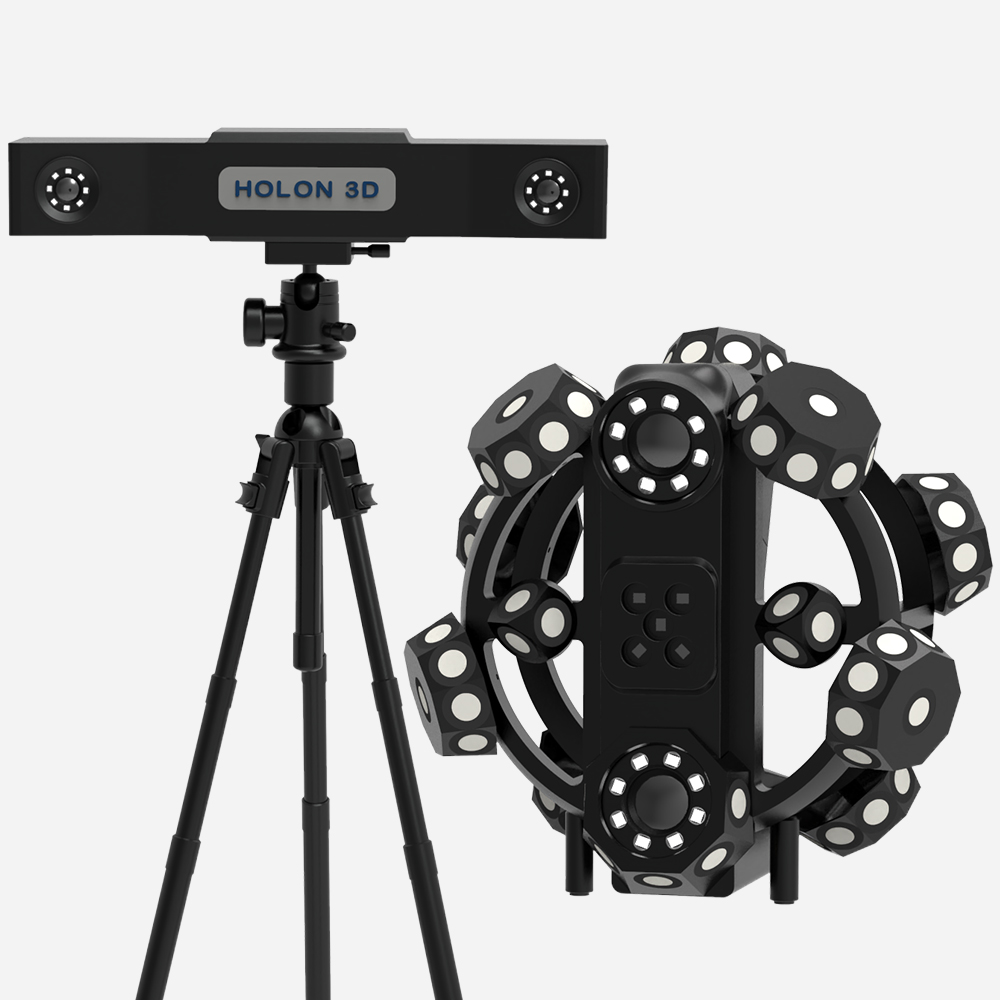
The Holon 3D engineer arrived at the customer site with the company‑developed handheld 3D scanner. Within 5 minutes, millions of high‑precision point‑cloud data points covering both the inner and outer surfaces of the speaker housing were fully acquired, precisely capturing every undulation of curved surfaces, mesh hole features, and detailed assembly structures. The scanned data and original CAD model were imported into the inspection software. After automatic alignment, an intuitive 3D color chromatogram deviation plot was generated. Green indicates qualified areas, while red or blue indicates out‑of‑tolerance areas. The overall trend of the housing’s curved surfaces, positional offsets of hole sites, and contour deviations of boundaries can be seen clearly at a glance. Arbitrary cross‑sections can be extracted within the software to accurately measure critical dimensions such as mesh hole diameters, screw post heights, and assembly clearances. Meanwhile, flatness and parallelism analyses can be performed on the mating surfaces to quickly determine whether assembly requirements are satisfied.
Scan STL data (1)

Scan STL data (2)
Deviation chromatogram
The use of industrial‑grade scanners has not only reduced the overall inspection time by more than 80%. More importantly, surface deviations and hole‑position offsets that are hard to detect manually have been identified in a timely manner. This has significantly improved the product assembly yield and acoustic consistency, and provided solid data support for the high‑quality manufacturing of acoustic products.