







- A +
- A
- A -
Small, threaded components demand extremely high precision, as even the slightest deviation can compromise product performance or lead to assembly errors. Traditional measurement and mapping methods struggle to fully capture their complex surfaces and intricate thread details, resulting in incomplete data for reverse modeling and limiting product development and optimization. A team plans to implement advanced Hualang 3D scanning technology to reverse-model these components and establish a precise data foundation for future product iterations and upgrades.

On-site scan image
For small workpieces with intricate surface details, conventional inspection methods are prone to data loss or distortion. Manual measurement of fine features—such as the helical surfaces of threads and thread profiles—is inefficient and makes error control difficult. Furthermore, conventional methods cannot capture data on internal structures or hidden defects, resulting in incomplete reverse modeling outcomes and failing to provide a comprehensive, accurate basis for product development.

Scan data plot

Magnified view of a section of the scan data
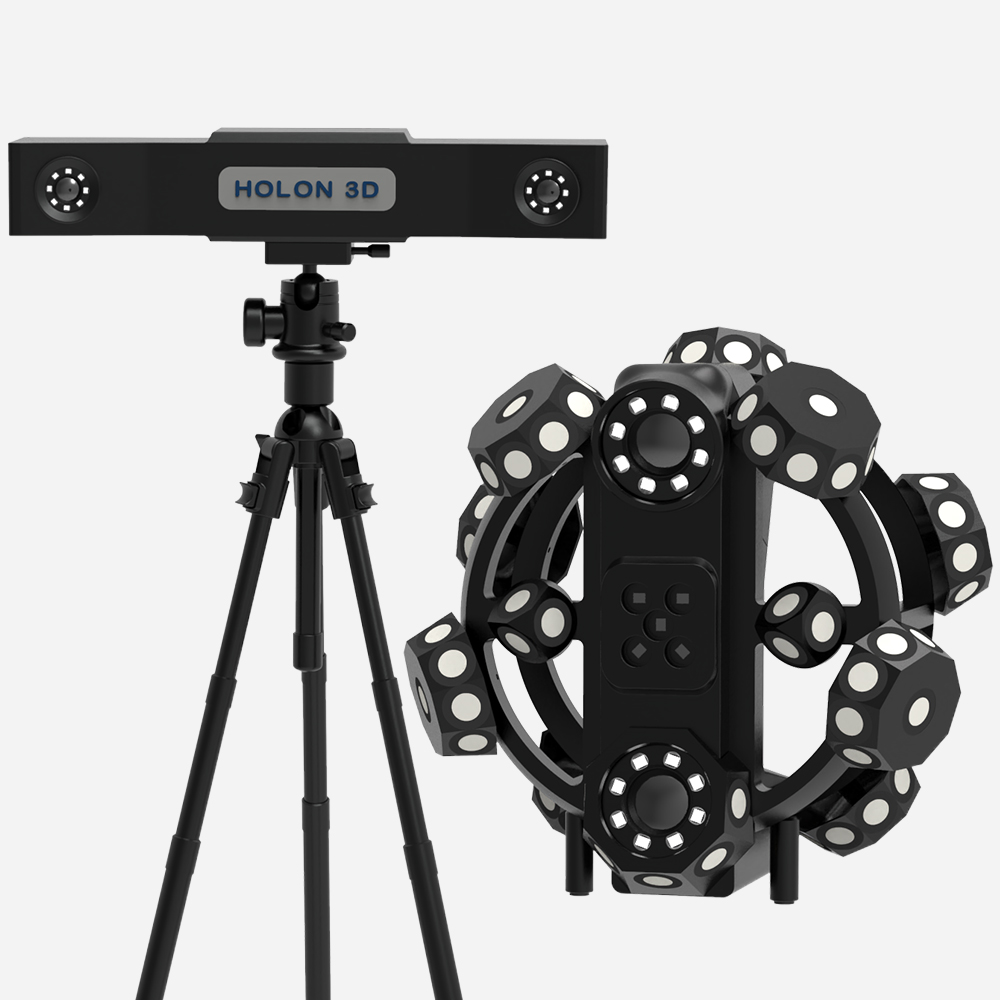
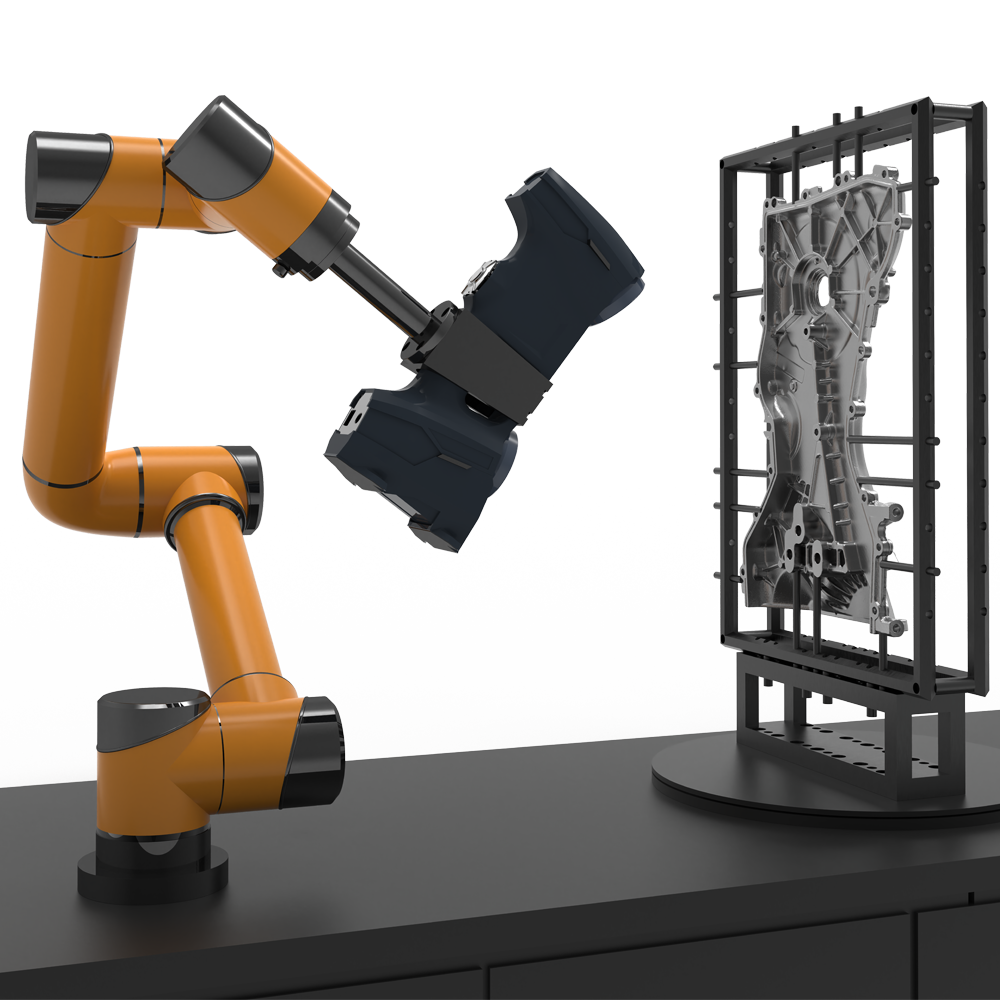
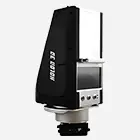
Utilizing the HOLON 3D high-precision scanner—which combines all-blue laser technology with adjustable lighting—we effectively overcome challenges posed by workpiece surface conditions. With metrology-grade scanning accuracy and rapid point-cloud acquisition, we faithfully capture critical structural details such as thread profiles and complex curved surfaces. Non-contact scanning ensures zero damage to the workpiece; when paired with professional reverse engineering software, it generates high-precision 3D models for analyzing dimensional deviations and structural defects. The resulting comprehensive scan data not only provides a precise foundation for reverse modeling but also empowers clients to optimize product designs, shorten development cycles, and enhance product competitiveness.

Reverse modeling diagram

Data Comparison Chart